
SMHI Aqua
Forecasts for water flows are crucial both in situations where there is a risk of flooding and in cases of drought and water scarcity. SMHI Aqua is a paid service that provides, among other things, hydrological and meteorological real-time and forecast data presented in an easily accessible format.

Carolina Cantone
Product Owner Hydrological Real-time Information
SMHI Aqua provides a quick, comprehensive view of the specific area being queried. A hydrological forecasting model can be calibrated for the particular watercourse relevant to your operations, and daily updated forecasts are presented on various timescales. This provides optimal support for adhering to existing water regulations and managing water resources during drought conditions. Forecasts for the next ten days up to six months enable both short- and long-term planning.
Whether the drinking water production comes from surface water, groundwater, or desalination plants, the forecasts can assist in decisions about when to use which source and for what duration.
 Zoom image
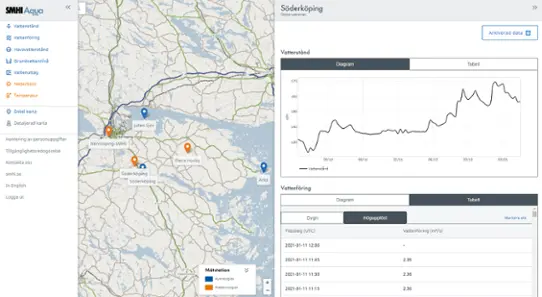
Visualization of hydrological measurements from stations in Aqua. Stations are depicted as pointers on the map, by clicking on any of them, a diagram showing data for the past three months pops up. Time series can also be visualized in tables which are easily exportable to standard format files as csv of txt.
Customizable for Various Needs
SMHI Aqua can be used by different users with diverse needs. For example, coastal municipalities might be affected by sea conditions, and the presentation of sea level observations in Aqua can facilitate their planning efforts.
Users of the service can select the relevant conditions and easily monitor forecasts for their area. The service also offers support from SMHI’s field technicians, who can assist by establishing new measurement stations that provide real-time data. This data is sent to SMHI, where it is stored and presented alongside other available information in Aqua.
The forecasting model can also be linked to activate alerts and warnings, which can be sent via SMS and email when selected thresholds for high or low levels or flows are reached.
 Zoom image
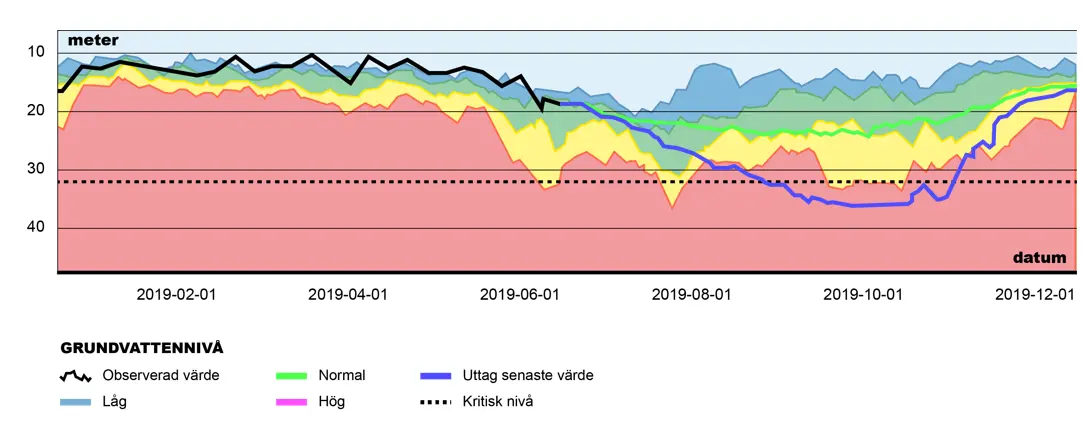
Example of visualization of long-term forecasts for groundwater levels. The graph shows observed values (black line) six months back and forecasts (blue and green lines) six months from today. Forecast lines show how the levels are affected from different water extraction strategies. The background represents the historical measured levels in the reservoir and the color field is divided according to the deviation from normal condition (high, near or below normal)
Try SMHI Aqua
A demo version of SMHI Aqua is available for testing. Here, you can view data from meteorological and hydrological monitoring stations, including precipitation, temperature, streamflow, water levels, and sea levels. You can easily switch the background map and view observed data in charts and tables.
