
HYFO – support tool for decision making
HYFO is a customized visualization and information system with observations and forecasts that provides a good basis for decision-making in hydro-power production and water resources management.

Carolina Cantone
Product Owner Hydrological Real-time Information
HYFO is SMHI’s modern presentation system for hydrological and meteorological observations and forecasts. This web-based presentation tool is developed in consultation with our customers and can be tailored according to your needs and preferences.
- Precipitation
- Temperature
- Water flow/inflow
- Snowpack
- Soil moisture deficit
Presentations can be made in map view, tables, and/or as time series in graphs.
Quick assessment of the current situation
Hydrological parameters for all of Sweden are calculated using SMHI’s hydrological model HYPE, which, together with meteorological models, provides the opportunity for forecasts up to 10 days ahead.
Statistical analyses and precipitation totals for various periods help in assessing the current situation. Maps showing whether the flow is rising or falling and the water content in the snow compared to normal can be displayed and presented for all of Sweden.
Customizable according to your needs
For those requiring specially tailored hydrological forecasts, SMHI’s well-established and high-quality hydrological model, the HBV model, can be set up for selected lakes/rivers and customized to provide forecasts for both the short and long term within the relevant area. It is also possible to add the display of your own observations and measurement stations in the system.
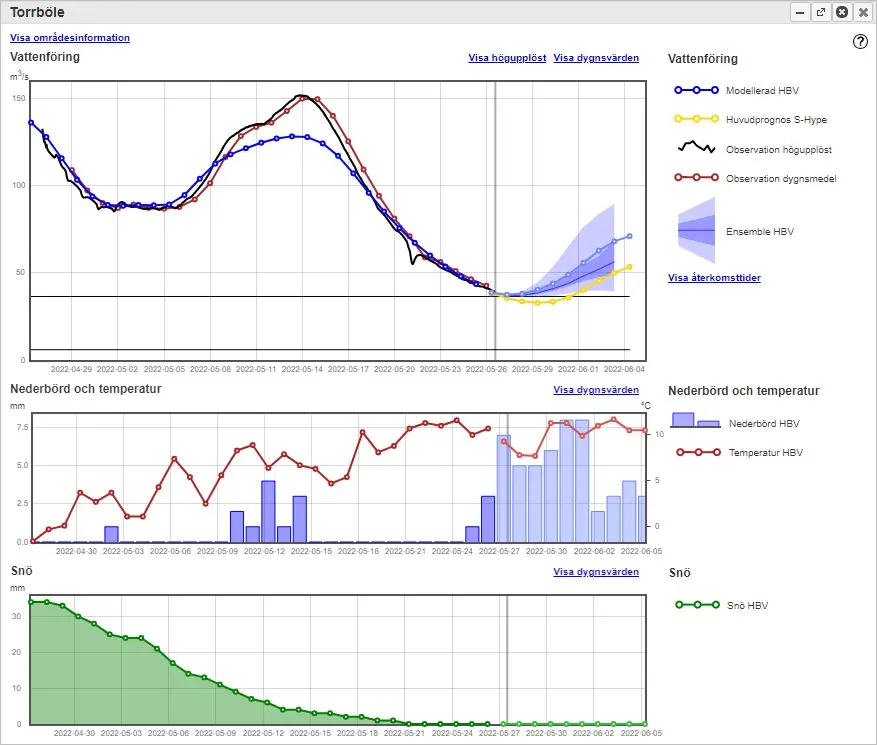 Zoom image
Example presentation of flow rates, precipitation, temperature, and snowpack from Fryele in Lagan.
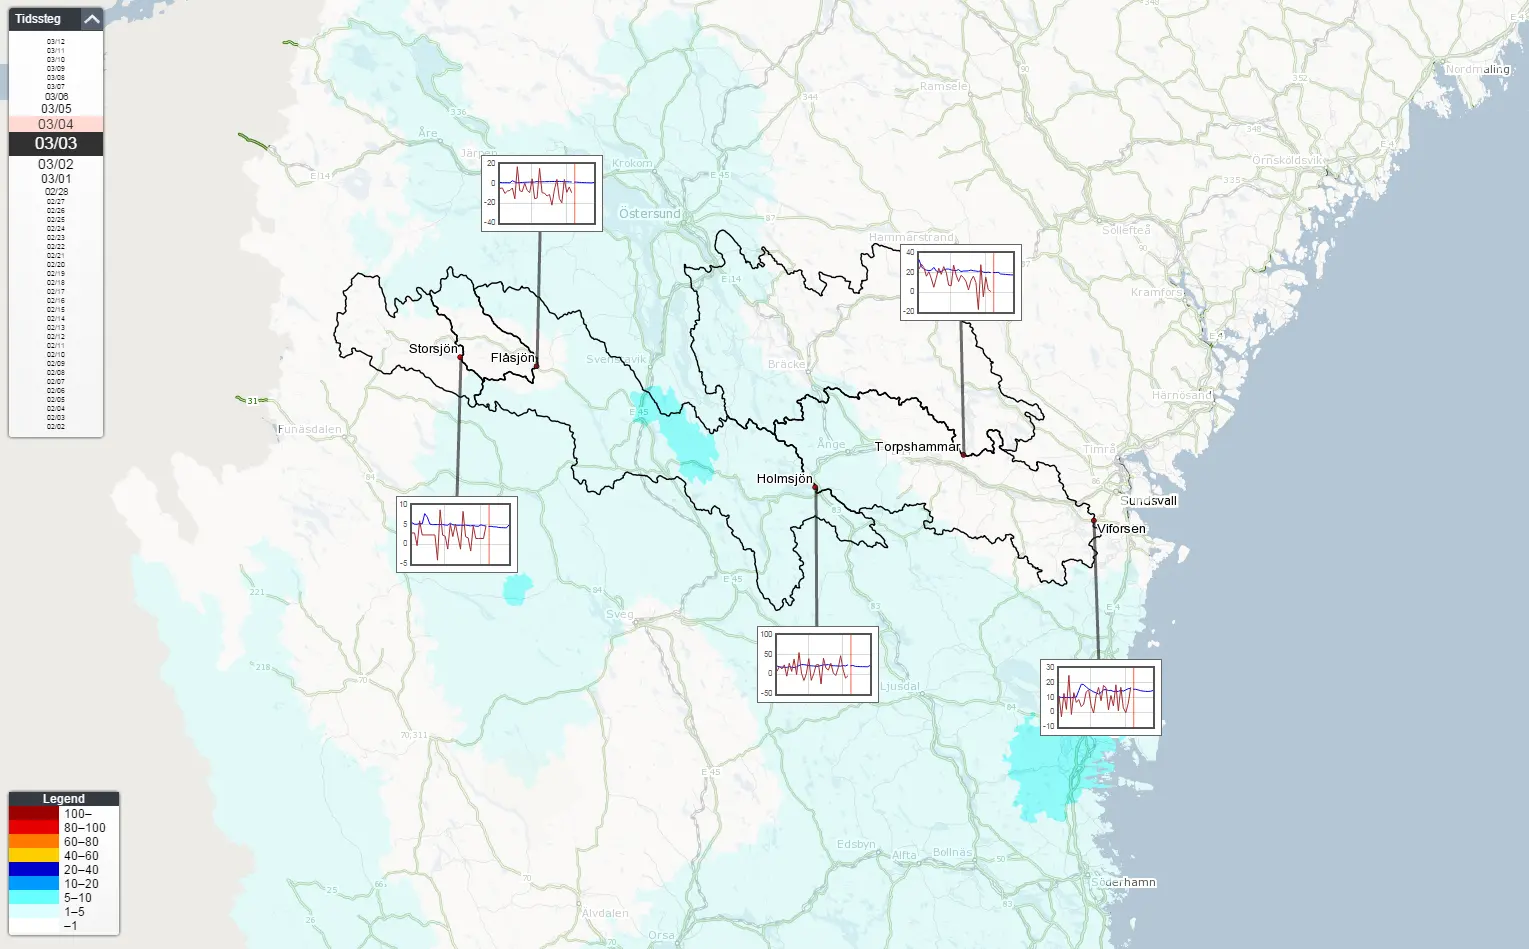 Zoom image
Figure shows a selected basin and the river outflow. For each sub basin outlet point, a graph with observed and modeled flows is displayed. The graphs can be enlarged by clicking on them. Background map shows the modelled precipitation in the area.